


How Much Opportunity Did YOUR Childhood Neighborhood Provide?
Find out with this neat tool!

In the next few weeks we will be publishing a piece in the Connors Newsletter explaining what the leading research tells us about how the communities where American children grow up influence the lives that they go on to lead as adults.
In anticipation of that piece, we thought we would bring to your attention a really neat tool that you can use to examine the impact of your own childhood community on the lives of those who were raised there.
The tool is called the Opportunity Atlas and can be found at OpportunityAtlas.org. It was developed by renowned Harvard University economist Raj Chetty and his colleagues.
The Opportunity Atlas allows you to easily make use of anonymous IRS tax data from over 20 million Americans born between 1978-1983. These data tell us about their adult outcomes, such as income, employment status, marital status, and more. What is so unique about this website is that it links those tax records to U.S. Census Bureau data about the communities where those adults were raised as children. So you can explore which areas of the country offer the most opportunity and which ones the least, as well as the characteristics of those high- and low-opportunity communities.
The best part is you do not need any expertise whatsoever, just the ability to point and click!
Wanna give it a try?
If so, open up OpportunityAtlas.org in your internet browser. Once you have arrived, click “begin exploring.”

Then, in the search bar at the top left-hand corner of the screen, enter the address of your childhood home.
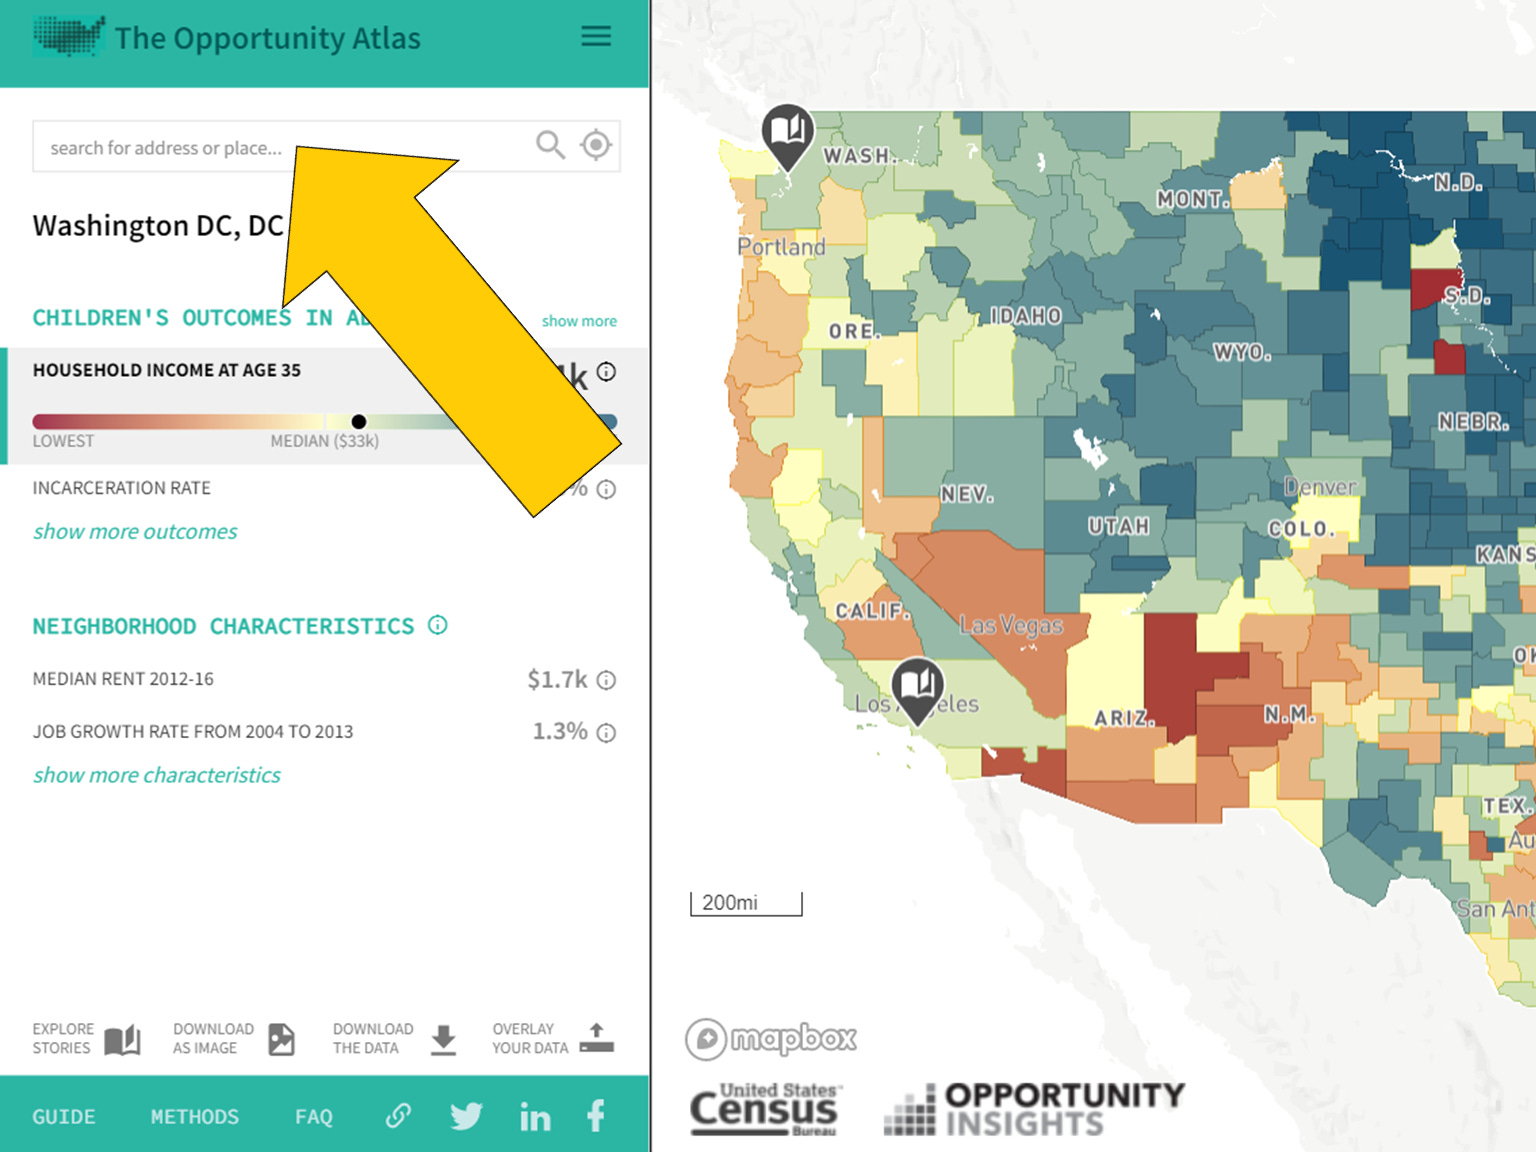
Next, in the panel at the top right-hand corner of the screen, select the income group you want to focus on. I typically examine a specific income group. If you look at all the kids who grew up in a rich neighborhood and compare them with all the kids who grew up in a poor neighborhood, for example, it is hard to tell whether their adult outcomes were the result of their households’ advantages/disadvantages or their communities’ advantages/disadvantages. But if you just look at kids from similar income groups who grew up in different neighborhoods, you are getting closer to examining just the effects of the communities where people were raised, not the effects of their household characteristics.

Once you have entered your childhood address and selected the group to focus on, take a look at the “children’s outcomes in adulthood” panel on the left-hand side of the screen to see things like average income, rate of incarceration, and rate of upward mobility (labeled as “frac. in top 20% based on household income”). These measures are for the children in the income group you have selected who grew up in these communities and are now in their mid-30s.
How did their lives play out? Did they play out similarly or differently from kids raised in other communities across this particular region?
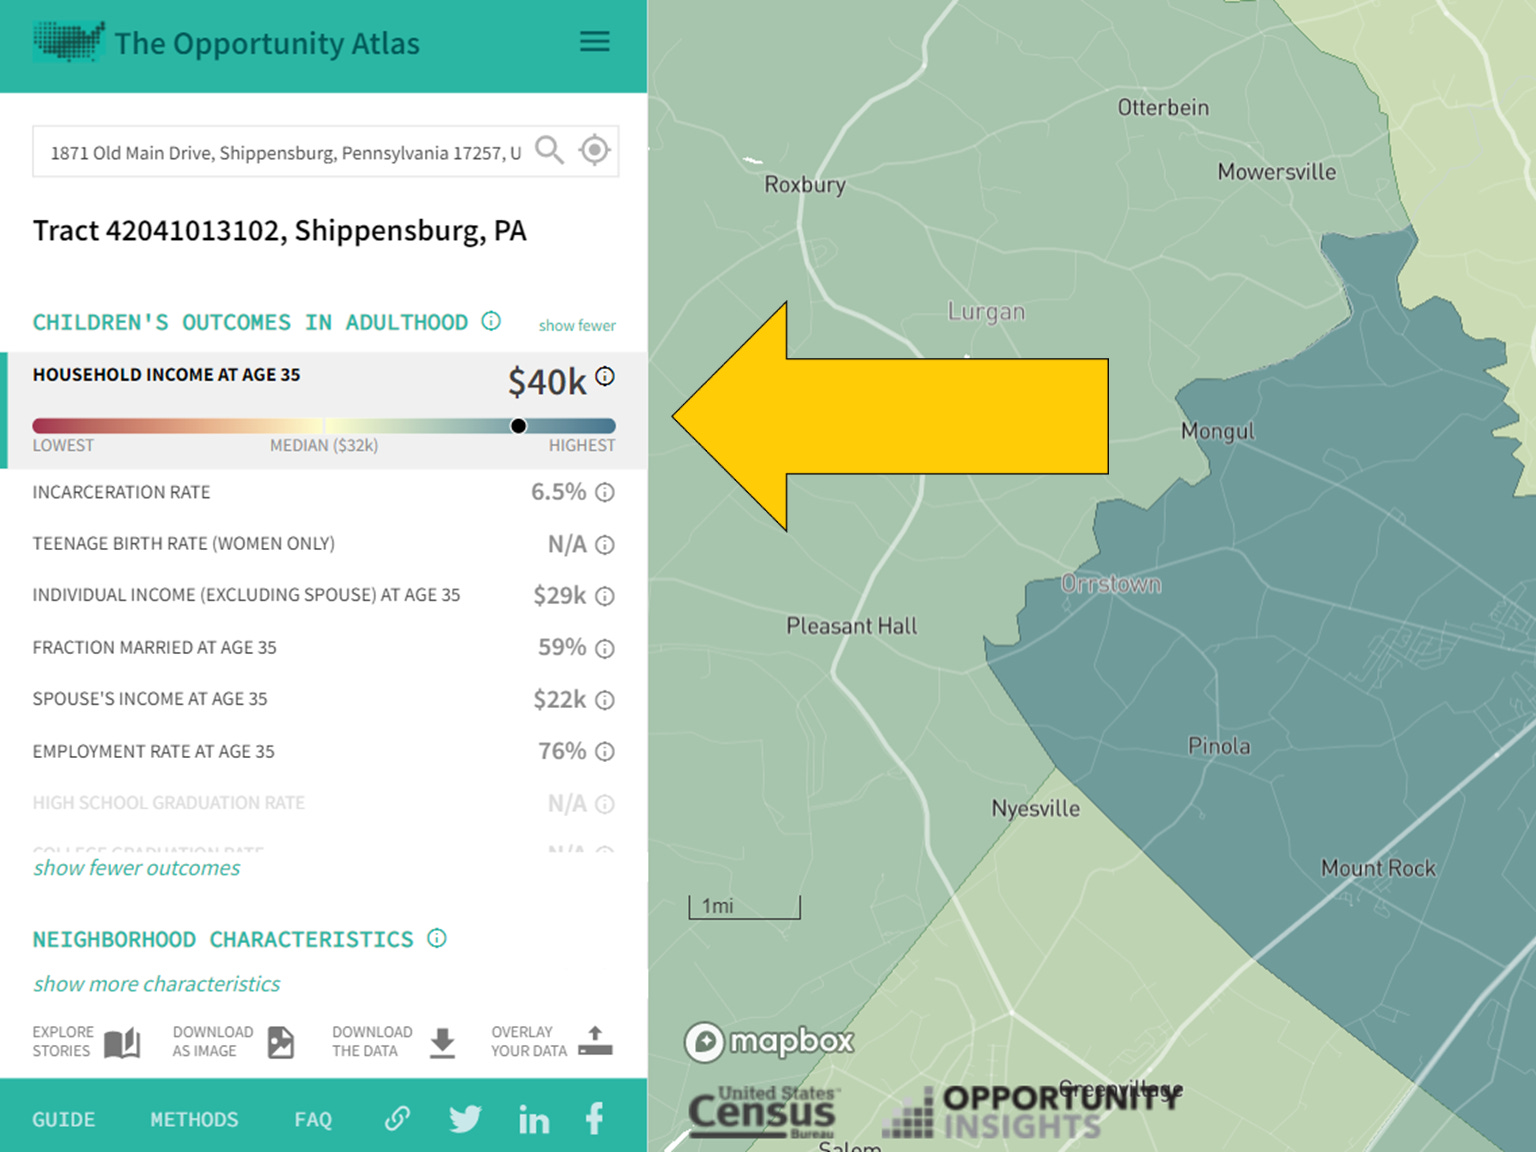


In the bottom “neighborhood characteristics” panel on the left-hand side of the screen, you can examine the various place-based characteristics that might contribute to the opportunities (or lack thereof) that communities offer children, including measures such as community rates of poverty, single parenthood, college graduation, job growth, and much more.

We hope you enjoy navigating this very useful website and please keep an eye out for our newsletter article on American communities coming soon!